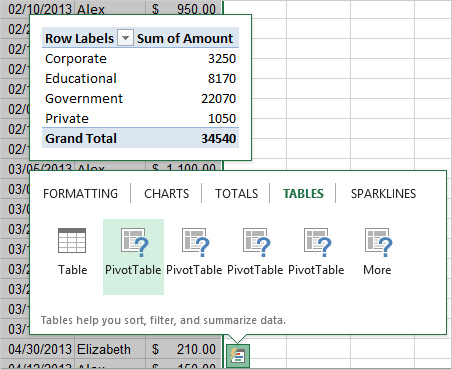
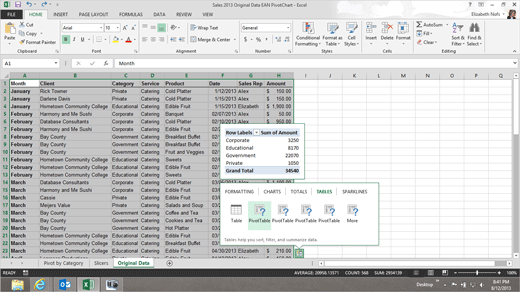
graphic2
graphic1

Exam 77-420 Microsoft Excel 2013
5. Create Charts and Objects 
5.1 Create a Chart: Use Quick
Analysis

Quick Analysis ->Tables ->PivotTable

Quick Analysis Tables

2. Try This: Create Tables with Quick Analysis

Go to the Original Data spreadsheet.

Select a Range: A1:H71.


Look for the Quick Analysis Tool: The Quick Analysis tool should be just outside of the selected Range of Cells.


And Definitely Try This: Use Quick Analysis

Click on Tables->PivotTable.

What Do You See, Now?
A PivotTable should pop up and display your data. Each Table shows a different placement of the Fields in the Rows, Columns. The PivotTables include Sum and Count for calculating the Totals.

Quick Analysis should work even better on a SmartPhone or Tablet.

This is getting to be Very Good Software, indeed.


pic1