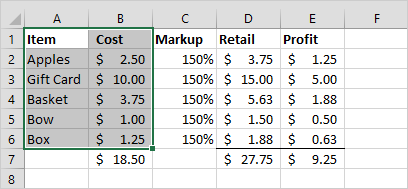
Exam 77-420 Microsoft Excel 2013 Our goal is to
show the percentage of cost that comes from the
apples, basket, bow and box. A
pie chart is a good way to represent the data. 1. Try it:
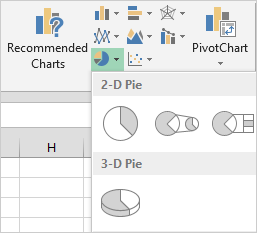
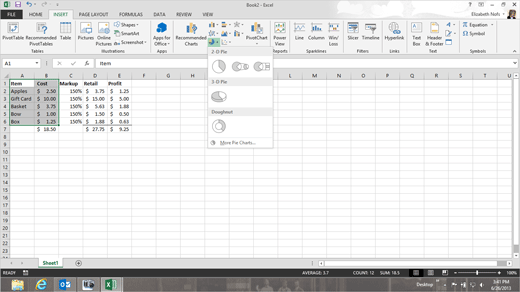
Insert a Pie Chart Select Cells
A1 through B6. Go to
Insert -> Charts. Click on
Insert Pie or Doughnut Chart. Select the
3D Pie from the options. Keep going...
|
|

| |