|
Exam 77-427 Microsoft Excel 2013 EXPERT Slicers
are a new way to filter the data in PivotTables and PivotCharts. The next
couple of pages begin with a new PivotChart and demonstrates how
you can use the Slicers.
1.
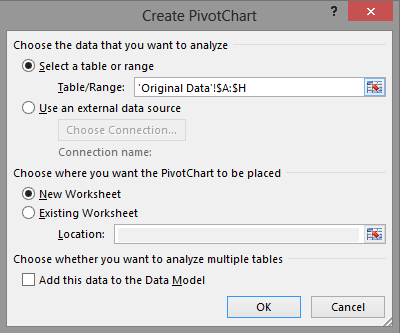
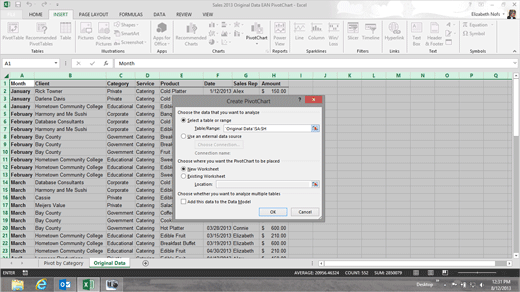
Try it: Create a new PivotChart Go to the
Original Data spreadsheet. Click on
PivotChart. You will
be asked to confirm the location of the data and whether you would
like to place the new PivotChart in a New Worksheet. Insert-> Charts->PivotChart->PivotChart
|
|

| |